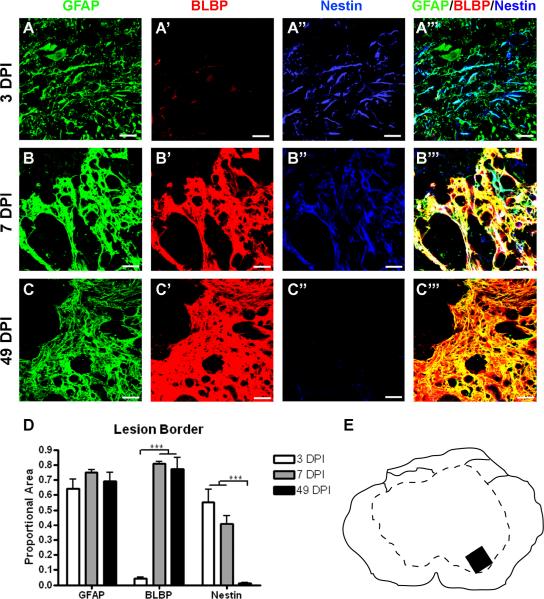
Figure 5.
Nestin expression increases transiently after injury in the lesion border, while BLBP levels rise later and stay high chronically. (A–C) Representative confocal images of GFAP (green), BLBP (red), and nestin (blue) expression and merged images of three markers (right) at 3 DPI (A–A'''), 7 DPI (B–B''') and 49 DPI (C–C'''). (D) Quantification of the proportion of merged staining area represented by GFAP, BLBP, and nestin expression levels over time. Scale = 20 μm. (E) Schematic depicting region shown in confocal images. ***p < 0.001 (BLBP 3 vs. 7 and 49 DPI; nestin 3 and 7 vs. 49 DPI).

