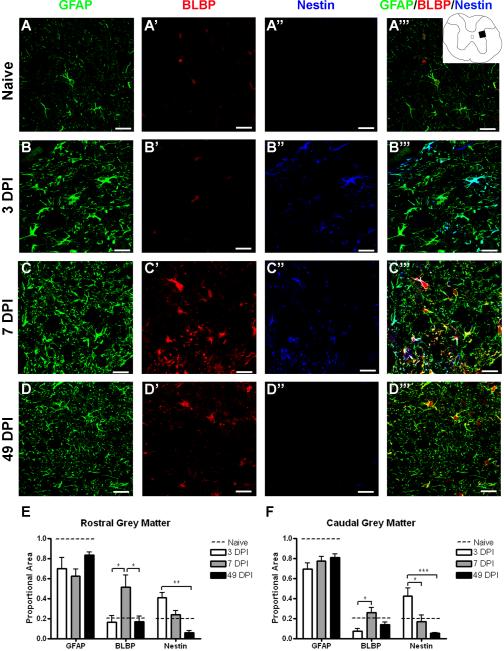
Figure 6.
BLBP and nestin expression transiently increase in spared grey matter. (A–D) Confocal images of GFAP (green), BLBP (red), and nestin (blue) in naïve tissue (A–A''') and 1.0 mm caudal from the lesion epicenter at 3 (B–B'''), 7 (C–C''') and 49 (D–D''') DPI. Inset depicts region shown in confocal images. (E–F) Quantification of the proportion of merged staining area represented by GFAP, BLBP, and nestin immunoreactivity over time both rostral (E) and caudal (F) to the injury epicenter. The dashed line in each graph depicts the proportion of merged staining colocalized with each of the markers in naïve tissue specimens. Scale = 20 μm. *p < 0.05 (BLBP rostral 3 vs. 7 vs. 49 DPI; BLBP caudal 3 vs. 7 DPI; nestin caudal 3 vs. 7 DPI), **p < 0.01 (nestin rostral 3 vs. 49 DPI), ***p < 0.001 (nestin caudal 3 vs. 49 DPI).

