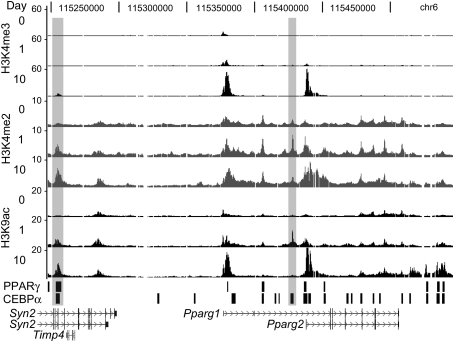
Figure 1.
Histone H3 modification profiles at Pparγ locus during 3T3-L1 cell differentiation. ChIP–chip mapping of H3K4me3, H3K4me2, and H3K9ac at days 0, 1, and 10 of 3T3-L1 differentiation. Fold enrichment values were plotted on a linear scale. Shaded rectangles indicate enrichment peaks for H3K4me2 and H3K9ac that are increased at day 1 relative to day 0 and not positioned at TSSs. Black bars indicate PPARγ- and CEBPα-binding regions in day 10 adipocytes.

