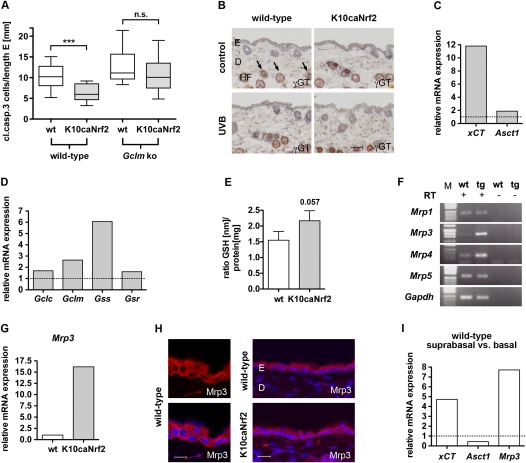
Figure 5.
GSH metabolism in K10caNrf2 transgenic mice. (A) Cleaved caspase-3-positive cells per length epidermis, 24 hpi, 100 mJ/cm2 in wild-type and K10caNrf2 transgenic mice crossed with wild-type (left) (N = 15, P = 0.0003) and Gclm knockout (right) mice (N = 14, P = 0.23). (B) γGT activity staining (auburn) in back skin of wild-type and tg mice, nonirradiated (control) and 24 hpi, 100 mJ/cm2 UVB-irradiated (UVB) mice. Arrows point to staining in lower hair follicle (HF). No staining is visible in the interfollicular epidermis. Bar, 50 μm. (C) qRT–PCR of xCT and Asct1 in epidermis of tg versus wild-type mice (set to 1, indicated by dashed line). (D) qRT–PCR analysis of Gclc, Gclm, Gss, and Gsr using RNAs from epidermis of wild-type and tg mice. The expression level in wild-type mice was set to 1, indicated by dashed line. The qRT–PCR data shown in C and D were obtained from pooled epidermal samples, and were reproduced with a different set of RNAs from different pools of mice. (E) GSH levels normalized to total protein in keratinocytes of wild-type and tg mice (N = 5, P = 0.0571). (F) RT–PCR of Mrp1, Mrp3, Mrp4, Mrp5 in wild-type epidermis with (+) and without (−) RT. (G) qRT–PCR of Mrp3 in wild-type and tg mice. (H) Immunofluorescence analysis of Mrp3 (red), counterstained with Hoechst (blue) in wild-type and tg mouse back skin. Bars: left panel, 15 μm; right panel, 30 μm. (I) xCT, Asct1, and Mrp3 expression in suprabasal relative to basal keratinocytes of wild-type mouse tail epidermis (average of two different separations), analyzed by qRT–PCR. (n.s.) Not significant.

