Figure 7.
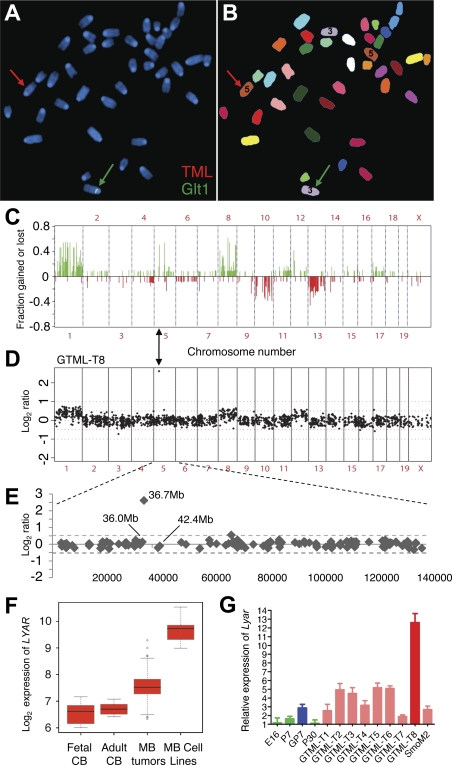
Genomic instability and Shh independence in GTML tumors. (A) Spectral karyotyping (SKY) and FISH in metaphase of a doubly hemizygous GTML mouse. The red arrow indicates hybridization of the TML probe (red) on chromosome 5. The green arrow indicates hybridization of the Glt1-tTA probe (Glt1; green) on chromosome 3. (B) Chromosomes shown in SKY display colors with chromosomes 3 and 5 indicated (the color scheme for all chromosomes is presented in Supplemental Fig. 6A). (C) Frequency plot of genomic changes in GTML tumors by array CGH. Tumors showed gains at chromosomes 1 and 11q and losses at chromosome 13 (syntenic with human chromosomes 6, 17q, and 1q, respectively), three sites frequently altered in human poor-risk MB. (D,E) CGH analysis for one tumor, GTML-T8, showed a subchromosomal amplification (36.7 Mb) on mouse chromosome 5. (F) Box plots showing human LYAR expression levels in MB samples and controls (as described in Fig. 1). (G) Expression analysis by qRT–PCR detecting the candidate gene Lyar in mice using previous set of controls in green and blue (see Fig. 5A). All GTML tumors (except GTML-T8 in dark red) are now presented in light-red bars.

