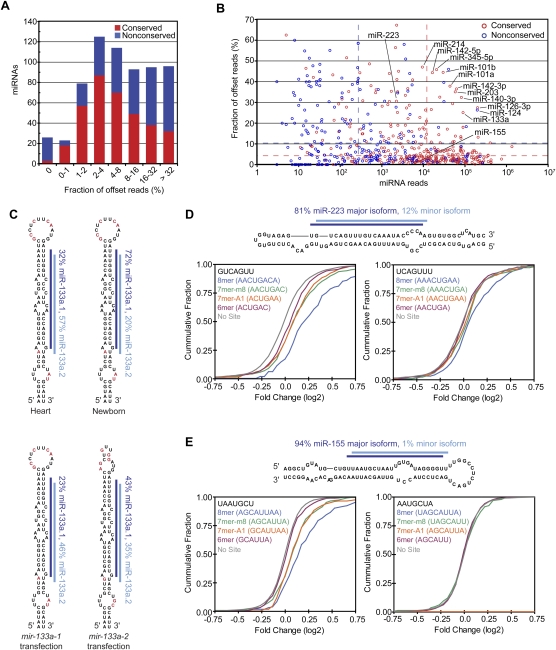
Figure 6.
miRNAs with 5′ heterogeneity. (A) The distribution of conserved (red) and nonconserved (blue) miRNAs with reads ≤5 nt offset at their 5′ terminus. (B) The fraction of offset reads and abundance of reads for each miRNA hairpin, colored as in A. The dashed lines indicate the median level of reads for conserved (red) and nonconserved (blue) miRNAs. (C) 5′ Heterogeneity of miR-133a. Data from mouse heart (Rao et al. 2009) and newborn are mapped to the mir-133a-1 hairpin (top), and data from the ectopic expression assay are mapped to the indicated transfected hairpin (bottom). The lines indicate miR-133a.1 (dark blue) and miR-133a.2 (light blue), and red nucleotides indicate those that differ between mir-133a-1 and mir-133a-2. (D) Effect of losing miR-223 on messages with 3′ UTR sites for miR-223 major and minor isoforms. (Top) Small RNA sequencing data from mouse neutrophils (Baek et al. 2008) were mapped to the mir-223 hairpin as in C. For each set of messages with the indicated 3′ UTR site for miR-233 (major isoform sites, bottom left; minor isoform sites, bottom right), the fraction that changed at least to the degree indicated following loss of miR-223 is plotted, using data published for neutrophils differentiated in vivo (Baek et al. 2008). (E) Effect of losing miR-155 on messages with 3′ UTR sites for miR-155 major and minor isoforms, plotted as in D using published data from T cells (Rodriguez et al. 2007). (Top) Sequencing data from our study are mapped to the mir-155 hairpin as in C. The mRNAs with 8mer and 7mer-A1 sites for the minor isoform were excluded from the analysis because these sites overlapped with 7mer-m8 sites for the major isoform.

