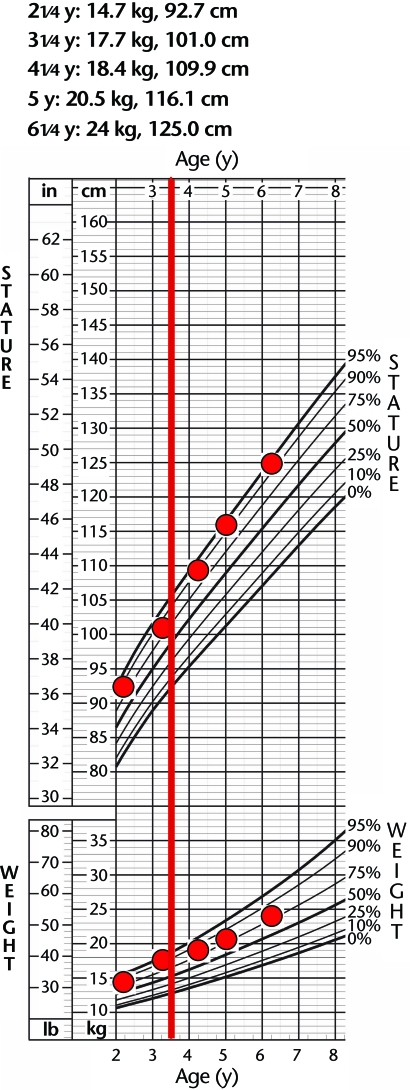
Figure 2.
Growth percentiles maintained after spinal cord injury. Measurements for height and weight were plotted against the national standards from the Centers for Disease Control and Prevention29 for children of the same age and sex. The red line at 3.5 years denotes the time at which injury occurred.

