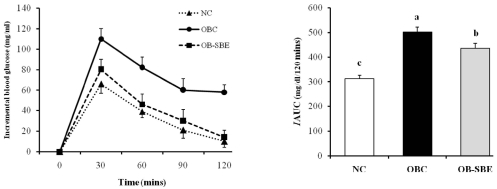
Fig. 2.
The effects of SBE on incremental blood glucose levels (left) and incremental area under the curve (right) after oral glucose tolerance test. Group abbreviation: NC; mice fed normal diet, OBC; mice fed the high fat diet, OB-SBE; mice fed the diet containing 5% Sasa borealis leaves extract. Mean values with different letters are significantly different between the three groups by ANOVA with Tukey's test at P < 0.05.

