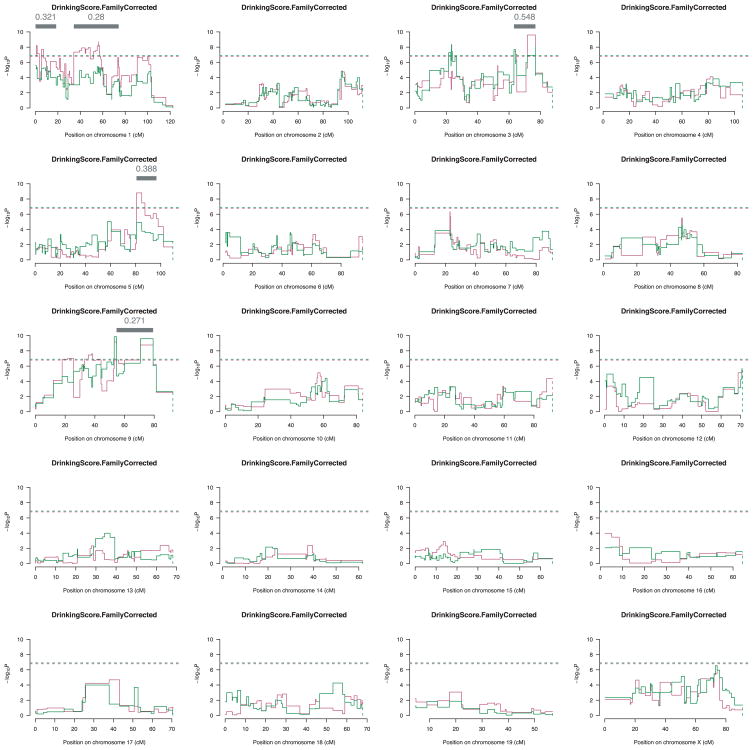
Fig. 2.
Genomewide analysis results from 989 F2 progeny. Results are shown for the additive (red) and full (green) genetic models. The Y-axis gives the negative log10 of the p value (−logp) of the test of association. The X-axis gives the chromosomal position of the analyzed SNPs. The additive model is shown with a red line, while the full model is shown with the green line. The gray bar denotes the 95% confidence interval for QTLs that exceed the genomewide significance threshold and which also have a greater than 95% posterior probability.

