Figure 2.
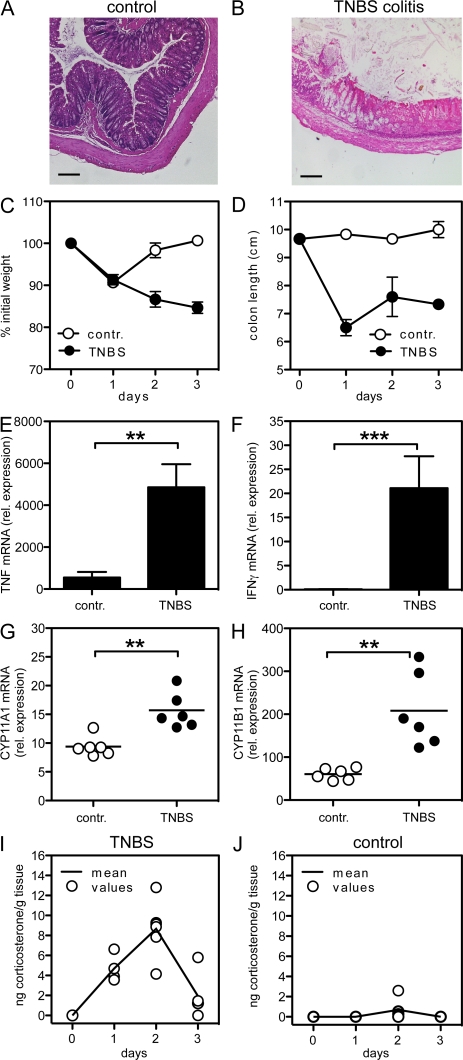
TNBS-induced Th1 colitis and intestinal GC synthesis. (A and B) Histology of control- (A) and TNBS-treated (B) mice at day 3. (C and D) Time course of weight loss (C) and colon length (D) in control- and TNBS-treated mice. Means ± SD are shown (n = 5 per group). (E and F) Expression of TNF (E) and IFN-γ (F) in control- and TNBS-treated mice at day 2. Means ± SD are shown (n = 5 per group). (G and H) Expression of the steroidogenic enzymes CYP11A1 (G) and CYP11B1 (H) in control- and TNBS-treated mice at day 2. Mean and individual values of five to six mice per group are shown. (I and J) Time course of GC synthesis in colonic organ cultures of TNBS- (I) and control-treated mice (J). Mean and individual values of two to six mice per time point are shown. **, P < 0.01; ***, P < 0.005. Pooled data are from three independent experiments. Bars, 100 µm.

