Figure 3.
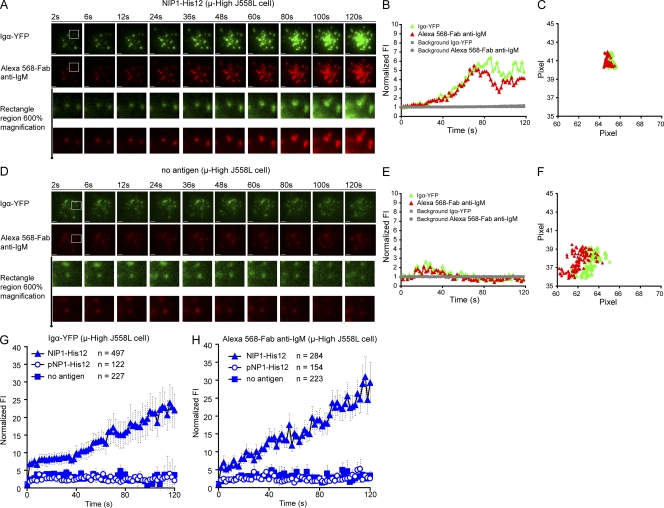
BCR microclusters grow in FI with time when encountering antigen-containing lipid bilayers. (A–F) Shown are two-color time-lapse TIRF images of μ-High J558L cells labeled with Alexa Fluor 568–Fab anti-IgM placed on planar lipid bilayers containing antigen NIP1-His12 (A–C) or lacking antigen (D–F) over a time course of 120 s (Video 5). The BCR microclusters were examined by simultaneously imaging Igα-YFP (green) and Alexa Fluor 568–Fab anti-IgM (red), as described in Materials and methods. Bars, 1.5 µm. Typical microclusters in the images indicated by the white boxes are shown at 600% magnification for better resolution. The FIs of these microclusters were fitted by a 2D Gaussian function for precise 2D (x, y) coordinates and integral FI profiles, as detailed in Materials and methods. The normalized FI (B and E) and 2D trajectories by means of x versus y footprints (C and F) accumulated over the 120-s time course of these two typical microclusters are given. The gray horizontal lines in B and E show the background FI values for these two typical microclusters over time. The background FI value is the Z0 value acquired in the 2D Gaussian function upon mathematical fitting, as shown in Fig. S4 A. The normalized FIs of all BCR microclusters analyzed by Igα-YFP (G) or Alexa Fluor 568–Fab anti-IgM (H) in μ-High J558L cells placed on lipid bilayers containing no antigen, NIP1-His12, or pNP1-His12 represent means ± SEM from 9–13 μ-High J558L cells in three independent experiments. For Igα-YFP clusters, data from six experiments were pooled.

