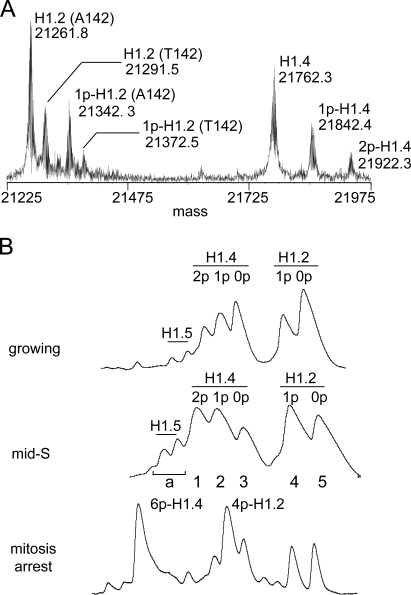
Figure 1.
The limited heterogeneity of H1 in HeLa cells. (A) The mass spectrum of intact crude H1 from asynchronous growing HeLa S3 cells. Proteins were identified directly by gas phase fragmentation and MS/MS analysis. Phosphorylation levels were inferred from predicted molecular masses. The A142T polymorphism in H1.2 was confirmed by genotyping (Fig. S1 B). (B) The HIC profiles of crude H1 from asynchronous growing, mid–S phase, and mitosis-arrested HeLa S3 cells. Eluate absorbance (214 nm) is plotted relative to time for equivalent portions of each separation. H1.2, H1.4, and H1.5 represent ∼47%, 48%, and 5% of total H1 in asynchronous cells, respectively, based on chromatographic integration.

