Figure 6.
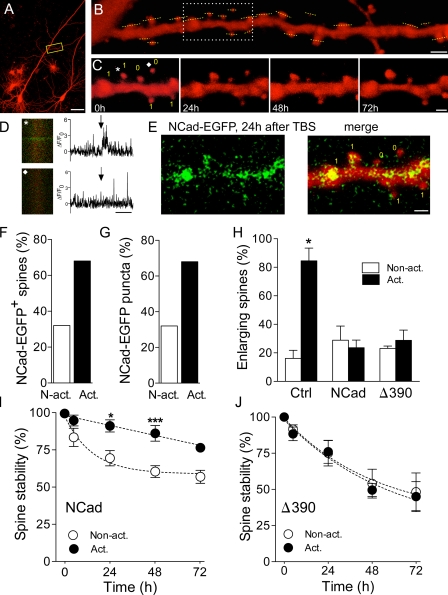
NCad is selectively expressed in potentiated synapses and is required for their long-term stabilization. (A) Illustration of an mRFP-transfected pyramidal neuron with the localization of a dendritic segment analyzed in B and C. The box shows the dendritic segment enlarged in B. (B) The mRFP-transfected cell in A was loaded with Fluo4-AM through bolus loading, and spines were tested using line scans (yellow dashed lines) for their response to stimulation pulses applied in the CA3 area. The delimited region shows the portion of dendrite illustrated in C. (C) Repetitive imaging at 24-h intervals of the same dendritic segment. The yellow number indicate whether the spines were activated (1) or not (0) by the stimulation pulses applied to CA3 neurons. The asterisk and the diamond show the localization of the spines in which the calcium signals illustrated in D were recorded. (D) Line scans obtained in the spines indicated by an asterisk or diamond in C. The graph shows the ΔF/F0 values for the corresponding line scans. Arrows indicate stimulation. (E) NCad-EGFP fluorescence (left) and signal merged with the mRFP fluorescence (merge) observed on the same dendritic segment 24 h after theta burst stimulation (TBS). Note that no NCad-EGFP fluorescence was detectable at time 0 (not depicted). The yellow numbers indicate which spines were activated (1) or not (0) by theta burst stimulation. (F) Proportion of activated (act.) and nonactivated (N-act.) spines expressing NCad-EGFP 24 h after theta burst stimulation (n = 31 activated and 29 nonactivated spines out of three experiments). (G) Proportion of NCad-EGFP puncta that appeared in activated versus nonactivated spines (n = 29 new puncta in three experiments). (H) Proportion of activated and nonactivated spines (mean ± SEM) that showed an enlargement of their spine head 5 h after theta burst stimulation (n = 4–6 experiments; 79, 168, and 122 spines analyzed in control [Ctrl]-, NCad-, and Δ390-NCad–transfected cells; *, P < 0.05; t test). (I) Stability of activated and nonactivated spines analyzed as the proportion of them still present on consecutive days in cells transfected with WT-NCad. Data are mean ± SEM of eight experiments (114 activated and 90 nonactivated spines analyzed; *, P < 0.05; ***, P < 0.001; two-way ANOVA with Bonferroni posttest). (J) Same as in I but for cells transfected with Δ390-NCad (n = 5; 55 activated and 67 nonactivated spines analyzed; P > 0.05; two-way ANOVA with Bonferroni posttest). Bars: (A) 100 µm; (B) 2 µm; (C and E) 1 µm; (D) 1 s.

