Figure 8.
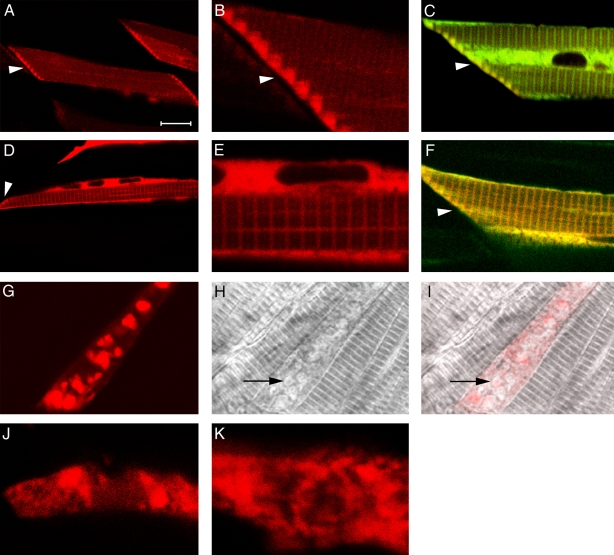
Localization of Apo2a and Apo2b fusion proteins. (A–C) Mosaic expression of Apo2a-mOrange1 fusion proteins in individual cells of the skeletal muscles. Cells expressing Apo2a-mOrange1 at low levels show enrichment of the fusion proteins at the myoseptal boundary (A and B, arrowheads). Low levels and more diffuse staining are present in the cytoplasm and over the myofibril. Enrichment of Apo2a-mOrange1 at the myoseptal boundary overlaps with Unc45b-TFP (C, arrowhead). (D–F) Mosaic expression of Apo2b-mOrange1 fusion proteins in individual cells of the skeletal muscles. Diffuse staining in the cytoplasm and in a striated manner at the Z line of the myofibrils was noted for this fusion protein. Apo2b–mOrange is colocalized with Unc45b over the Z line and also at the myoseptal boundary (D and F, arrowhead) in cells coexpressing Unc45b-TFP fusion protein (C). (G–I) Expression of Apo2a-mOrange1 at high levels results in aggregation of the protein in the cytoplasm (G). This results in loss of striation in highly expressing cells (H and I, arrows; overlay of G and H). (J and K) Lack of Unc45b protein leads to aggregation of Apo2a-mOrange1 (J) and Apo2b-mOrange1 fusion proteins. Bars: (A, C, D, and F) 16 µm; (B, E, J, and K) 4 µm; (G, H, and I) 10 µm.

