Fig. 4.
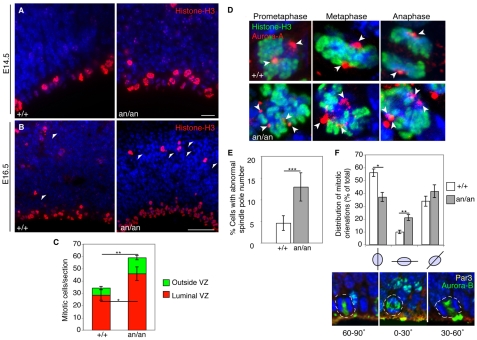
Cdk5rap2an/an neuronal progenitors exhibit mitotic defects and changes in mitotic spindle orientation. (A,B) Cdk5rap2 mutants have increased numbers of phospho-histone H3-labeled cells. Fluorescent micrographs of Cdk5rap2+/+ and Cdk5rap2an/an coronal sections at (A) E14.5 and (B) E16.5. Phospho-histone H3 (red) immunostaining shows cells in M phase lining the VZ, and away from the VZ (arrowheads). Nuclei are stained with Hoechst (blue). (C) Analysis of mitotic index in E16.5 embryos. M-phase cells counted along the luminal VZ from the medial-dorsal to the dorsal-lateral junction. Dorsal mitotic cells away from the VZ were also measured. The mean total mitotic cells per coronal section and their localization at the luminal VZ, or away from the VZ, are shown. At E16.5, Cdk5rap2an/an mice (n=5, average of 330 mitotic cells counted/animal) had 1.8-fold more M-phase cells than controls (n=5, average of 128 mitotic cells counted/animal); P=1.12×10⁻⁸. M-phase cells increased at the luminal VZ (*, P=5.64×10⁻⁶) and outside of the VZ (**, P=2.22×10⁻⁸). (D) Cdk5rap2an/an animals have abnormal numbers of spindle poles. Aurora kinase A labels spindle poles (red), whereas phospho-histone H3 labels M-phase cells (green). Arrowheads indicate aurora kinase A-labeled spindle poles. Representative confocal images of Cdk5rap2+/+ precursor cells (top) in prometaphase (left), metaphase (center) and anaphase (right) with bipolar spindles, and Cdk5rap2an/an precursor cells (bottom) in prometaphase with a tetrapolar spindle (left), in metaphase with a tripolar spindle (center), and in anaphase with a tetrapolar spindle (right). (E) Cdk5rap2an/an animals show a 2.8-fold increase in the percentage of abnormal mitotic figures per total number of M-phase cells at the luminal VZ. ***, P=3.26×10⁻⁶. (F) Analysis of spindle orientation at E16.5. Bar chart shows the distribution of horizontal (0-30°), oblique (30-60°) and vertical (60-90°) cleavage planes. Cdk5rap2an/an embryos have increased horizontal and decreased vertical cleavage planes (n=4, average of 88 cells counted/animal; **, P=0.005), compared with Cdk5rap2+/+ embryos (n=4, average of 89 cells counted/animal; *, P=0.006). Beneath are shown representative three-dimensional reconstructed confocal images of horizontal, oblique and vertical cleavage planes. Nuclei are stained with Hoechst (blue), the central spindle and midbody are stained for aurora kinase B (green), and the apical membrane is stained for Par3 (yellow). Error bars indicate s.d. Scale bars: 10 μm in A; 50 μm in B.

