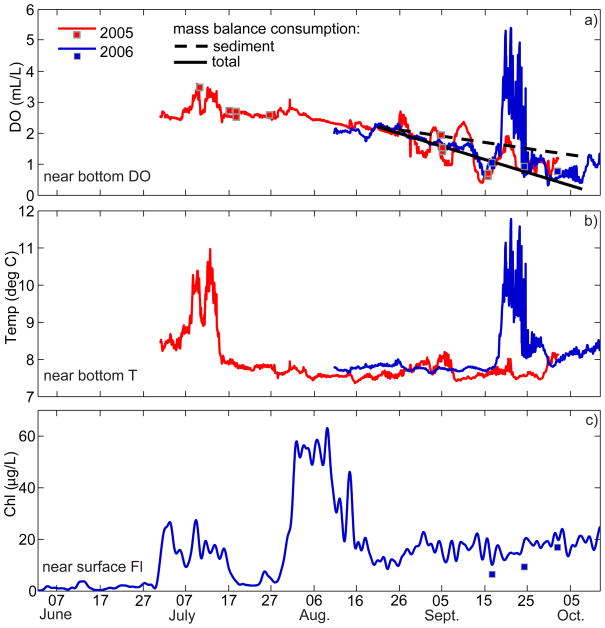
Figure 10.
Hourly time series of near-bottom DO (a) and temperature (b) at the E4 mooring location for 2005 (red lines) and 2006 (blue lines). Near-bottom DO concentrations from shipboard profiles are shown as squares. Dashed black line represents consumption of DO due to sediment demand calculated in Section 4.2 d; solid black line represents total DO consumption. c) Near surface fluorescence at the E2 mooring for 2006. Chl a concentrations from bottle samples are shown as squares.

