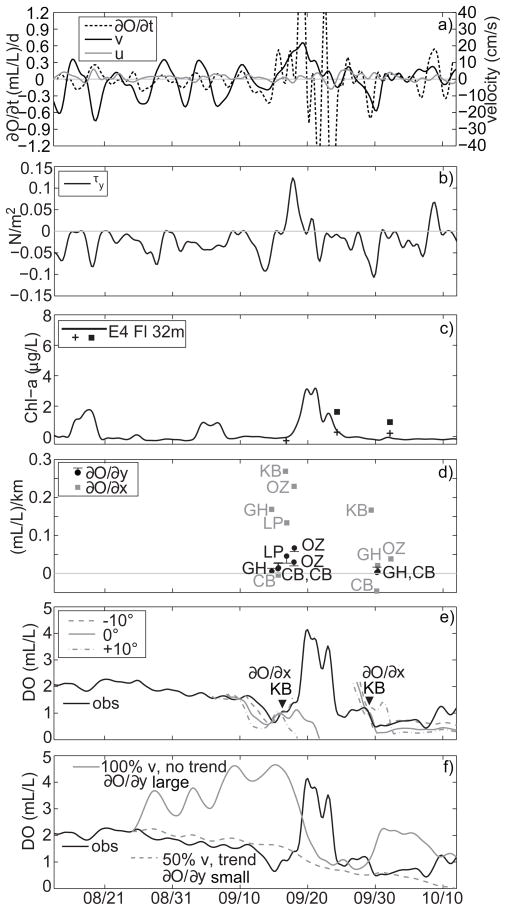
Figure 12.
Time series during the period 13 August 2006 through 12 October 2006. a) Near-bottom DO time derivative and u, v velocity components 12m above bottom at E4. b) Wind stress at NDBC Cape Elizabeth buoy 46041. c) Near-bottom fluorescence at E4,with near-bottom values from shipboard fluorescence profiles (crosses) and Chl a bottle samples (squares). d) DO spatial gradients in the x, y (grey, black) direction, with estimated error, E. e) Measured DO (black) compared to that predicted (grey) by both spatially variable gradients from the KB line with measured u. The dash-dot and dashed lines utilize velocity coordinate systems rotated ±10°. f) Measured DO time series (black) compared to that predicted (grey) by a constant along-shelf gradient and measured v. Solid line uses a large positive gradient. Dashed line uses a smaller gradient, includes total respiration calculated from the mass balance in Section 4.2 d, and velocity reduced by 50% to account for bottom friction.

