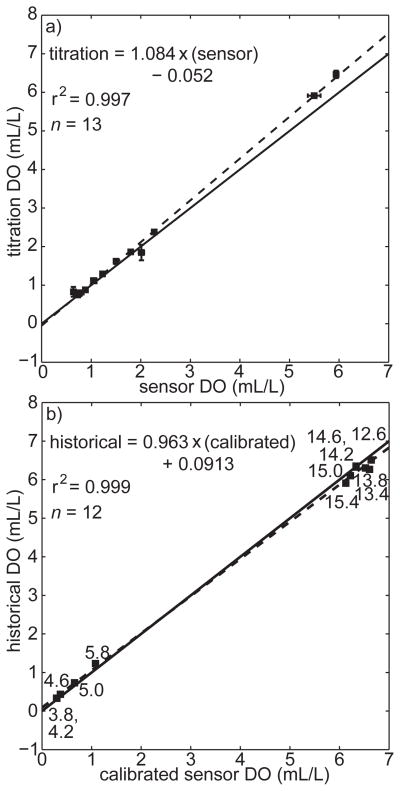
Figure 2.
a) Least-squares linear regression (dashed line) between DO concentrations measured by factory calibrated SBE 43 sensor (x-axis) and Winkler titration (y-axis) during the EH6 cruise in September 2006. Error bars, where visible, are standard deviations from triplicate samples. b) Regression between mean DO at selected temperatures from the calibrated sensor during the EH6 cruise and the historical data set, as described in the text. Numbers beside points are the center of the temperature bins. Solid lines designate 1:1 slope.

