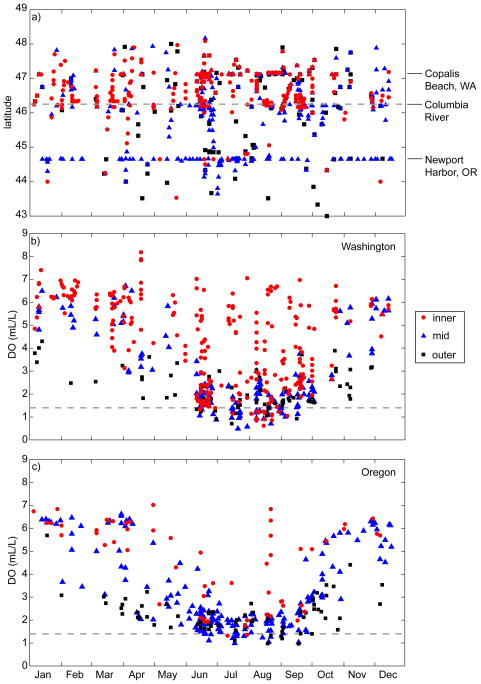
Figure 3.
a) Seasonal distribution of near-bottom DO measurements by latitude. Data are divided into three depth categories: inner shelf 0–40 m (red circles), midshelf 40–80 m (blue triangles), and outer shelf 80–130 m (black squares). The dashed lines indicate the division between Washington and Oregon data. b) Seasonal cycle of historical near-bottom DO over the Washington shelf. Symbols as in a. Dashed line indicates the 1.4 mL/L definition of hypoxia. c) Seasonal cycle of historical near-bottom DO over the Oregon shelf, as in b.

