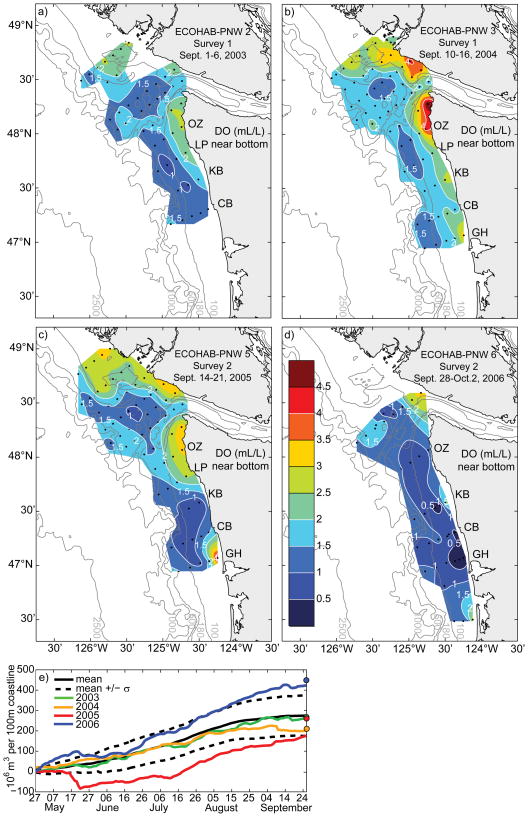
Figure 6.
Near-bottom dissolved oxygen during late summer/early fall from four different years: a) 2003, b) 2004, c) 2005, and d) 2006. DO contours, shown in the color bar in d), represent increments of 0.5 mL/L. Isobaths are indicated by grey contour lines. Station locations are shown as black dots. Abbreviations of selected transect names are shown along the Washington coast. e) Cumulative upwelling index (CUI) for the years 2003 (green), 2004 (gold), 2005 (red) and 2006 (blue). The curves show the CUI integrated from the start of the climatological upwelling season. Solid dots on the right side indicate the CUI that is obtained by integrating from the spring minimum to 26 September. The mean CUI for the years 1967–2006 is shown in solid black. The mean CUI +/− one standard deviation (σ) are shown in dashed black.

