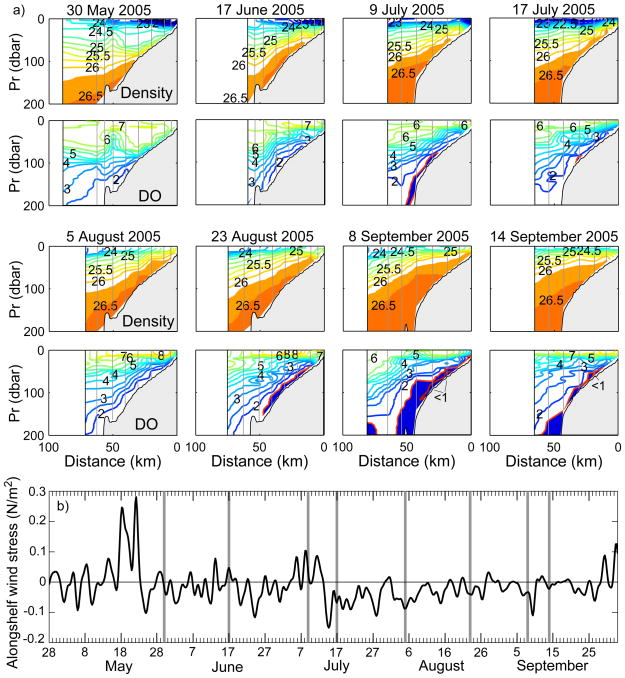
Figure 7.
a) Seasonal progression of density(first and third row) and DO (second and fourth row) off Grays Harbor during late May–mid September 2005. Grey vertical lines indicate cast locations. Contour intervals are 0.25 kg/m3 and 0.5 mL/L. The 1.5 mL/L and 1.0 mL/L DO contours are highlighted in red; DO concentrations below 1.5 mL/L are shaded in dark blue. b) Wind stress at NDBC Cape Elizabeth buoy 46041 during mid May through late September 2005. Downwelling favorable wind stress is plotted as positive; upwelling favorable wind stress is negative. Grey vertical lines indicate the timing of sections.

