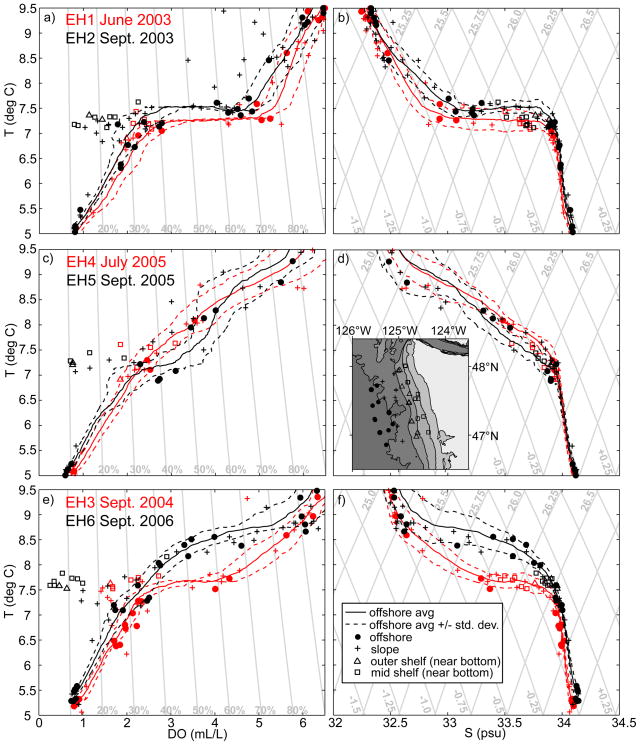
Figure 8.
Temperature vs. DO (a,c) and temperature vs. salinity (b,d) for six different cruises over the Washington shelf: June 2003 (a,b–red), September 2003 (a,b–black), July 2005 (c,d–red), September 2005 (c,d–black), September 2004 (e,f–red) and September 2006 (e,f–black). Solid and dashed lines represent a mean profile +/− the standard deviation of DO (a,c) and T (b,d) at >1000m bottom depth. Circles and crosses represent discrete values at standard depths (50, 100, 200, 500 m) at offshore (>1000 m bottom depth) and slope (130–1000 m bottom depth) stations. Triangles and squares represent discrete near-bottom values at outer and midshelf stations. Contours in a and c represent percent saturation. Contours in b and d represent σt and spice. Inset map in d shows station locations for discrete samples used from ECOHAB-PNW cruises 1–6.

