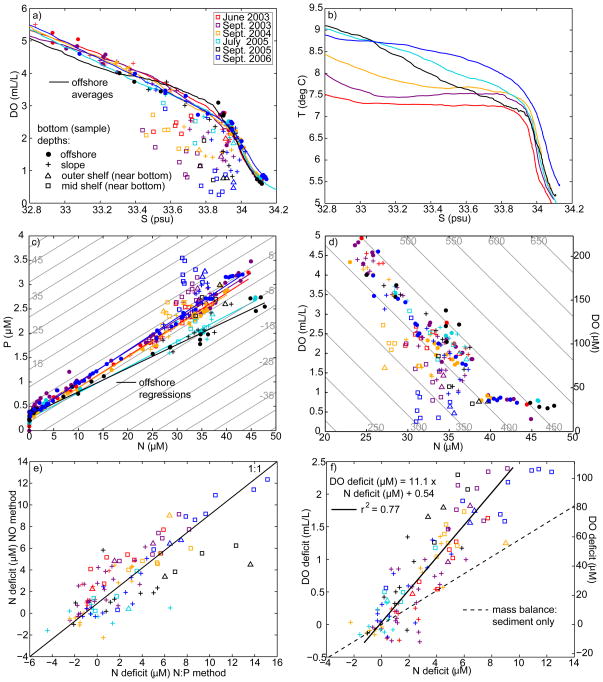
Figure 9.
a) Salinity and DO for offshore water, slope (100–200 m) water, and near-bottom shelf water. Symbols represent same range of bottom depths as Fig. 8. Solid lines indicate mean offshore profiles and colors represent different cruises. DO deficits are the vertical distance between discrete points and the mean offshore profile. b) Average offshore T and S relationships, same colors as in panel a. c) N and P, same colors and symbols as in panel a. Solid lines are linear regressions from offshore samples. Background contours represent constant -N*. N deficits are approximately equal to the distance across these contours between discrete points and the offshore regression. d) N and DO, same colors and symbols. Background contours represent constant NO. e) N deficit as calculated from the quantity NO compared with an alternate calculation based on N and P. f) Regression of DO and N deficits for slope source water and near-bottom shelf water.

