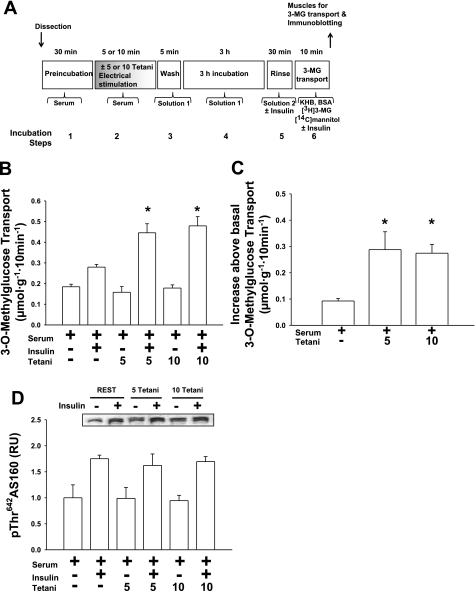
Fig. 4.
Comparison of 5 or 10 tetani in vitro electrical stimulation. Isolated rat epitrochlearis muscles were incubated in serum before and during in vitro electrical stimulation (5 vs. 10 tetani) or resting control and were subsequently incubated in buffer solution for 3 h. A: experimental design. B: rate of 3-MG transport; data for muscles incubated without insulin and those incubated with insulin were each analyzed with 1-way ANOVA and the Student-Newman-Keuls post hoc test. *P < 0.05 (significantly different from 3 h REST in the insulin-treated muscles). C: Δinsulin (increase above basal, calculated by subtracting the values for muscles incubated without insulin from the respective values of paired muscles incubated with insulin) for the rate of 3-MG transport; data were analyzed with 1-way ANOVA and the Student-Newman-Keuls post hoc test. *P < 0.05 (significantly different from 3 h REST). D: p642ThrAS160; data for muscles incubated without insulin and those incubated with insulin were each analyzed with 1-way ANOVA and the Student-Newman-Keuls post hoc test. Data are means ± SE, n = 5–6/group.

