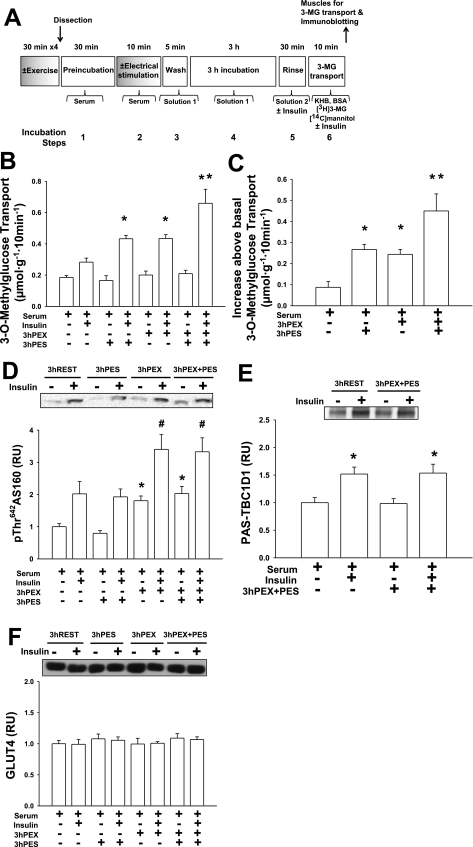
Fig. 5.
3 h postexercise + electrical stimulation (3 h PEX + PES). Following 2 h of exercise bout (4 × 30 min) or sedentary, isolated rat epitrochlearis muscles were incubated in serum before and during in vitro electrical stimulation or resting control and were subsequently incubated in buffer solution for 3 h. A: experimental design. B: rate of 3-MG transport; data for muscles incubated without insulin and those incubated with insulin were each analyzed with 2-way ANOVA and the Student-Newman-Keuls post hoc test. *P < 0.05 (significantly different from 3 h REST with insulin); **P < 0.05 (significantly different from 3 h REST, 3 h PEX, and 3 h PES muscles that were insulin treated). C: Δinsulin (increase above basal, calculated by subtracting the values for muscles incubated without insulin from the respective values of paired muscles incubated with insulin) for the rate of 3-MG transport; data were analyzed with 2-way ANOVA and the Student-Newman-Keuls post hoc test. *P < 0.05 (significantly different from 3 h REST); **P < 0.05 (significantly different from 3 h REST, 3 h PEX, and 3 h PES). D: p642ThrAS160; data for muscles incubated without insulin and those incubated with insulin were each analyzed with 2-way ANOVA and the Student-Newman-Keuls post hoc test. *P < 0.05 (significantly different from 3 h REST, comparison within muscles that were incubated without insulin); #P < 0.05 (significantly different from 3 h REST, comparison among muscles that were incubated with insulin). E: PAS-TBC1D1; data were analyzed with 2-way ANOVA and the Student-Newman-Keuls post hoc test. *P < 0.05 (significantly different from 3 h REST). F: GLUT4 abundance. Data are means ± SE, n = 8–14/group.

