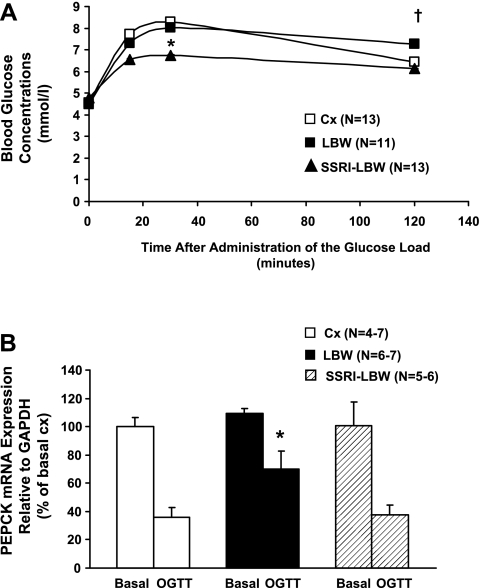
Fig. 2.
A: oral glucose tolerance test (OGTT). Full blood glucose concentrations are shown before and after administration of 2.5 g glucose/kg body wt given by gavage. Data are given as means ± SE. *P < 0.01, SSRI-LBW vs. LBW; †P < 0.05, LBW vs. SSRI-LBW and Cx. B: hepatic phosphoenolpyruvate carboxykinase (PEPCK) mRNA expressions in the basal (i.e., fasted overnight for 12 h) and the postprandial state [i.e., tissues taken out 90 min after glucose gavage (OGTT)]. Data are given as means ± SE. *P < 0.05 vs. SSRI-LBW and Cx.

