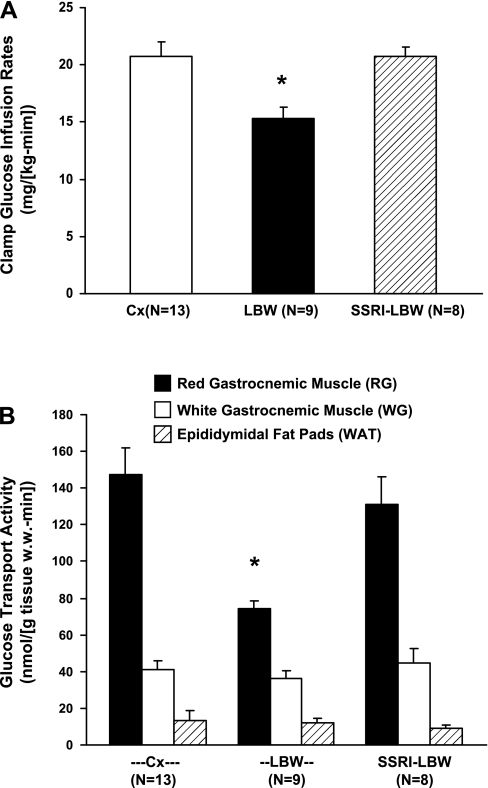
Fig. 3.
A: mean rates of glucose infusion from 90 to 150 min after initiation of the hyperinsulinemic euglycemic clamp experiment. Data are given as means ± SE. *P < 0.01 vs. SSRI-LBW and Cx. B: rates of insulin-stimulated glucose transport activities in red (RG) and white (WG) gastrocnemic muscle tissue as well as in epididymidal fat pads. Data are given as means ± SE. *P < 0.01 vs. Cx and P < 0.05, SSRI-LBW.

