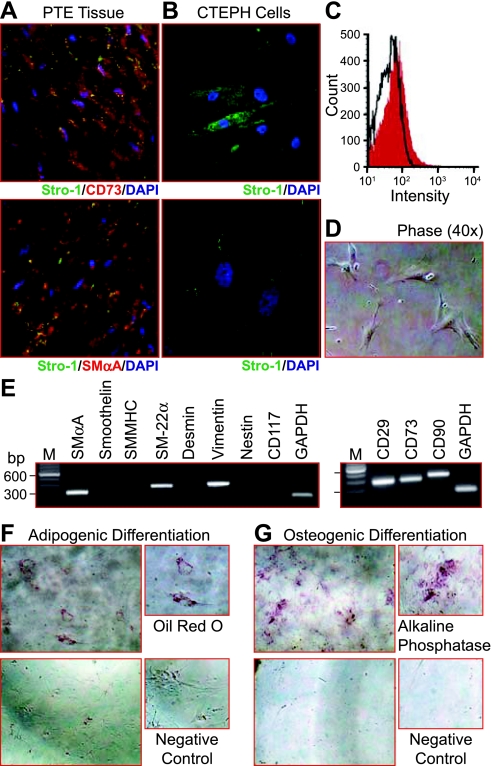
Fig. 7.
A subpopulation of multipotent Stro-1+ cells is present in CTEPH cells. A: Stro-1+ cells (green) are detected in PTE tissue sections and colocalized with CD73 (red, top) and SMαA (red, bottom). B: representative immunofluorescent images of Stro-1+-isolated cells (green). C: histogram summarizing the fluorescent-activated cell sorting (FACS) analysis for Stro-1 in cells isolated from PTE tissues, a 4.2% positive population was sorted. D: phase contrast (×40) image showing morphological homogeneity of Stro-1+ isolated cells. E: representative RT-PCR gel images showing mRNA expression for cell surface markers and cytoskeletal filaments associated with immature and progenitor cell types in Stro-1+ cells. F and G: representative brightfield images indicating adipogenic (Oil Red O, F) and osteogenic alkaline phosphatase, G: differentiation of Stro-1+, respectively. Images are takes at 7 days of differentiation at ×10; top panels are cells in differentiation media and bottom panels are cells in standard culture conditions.

