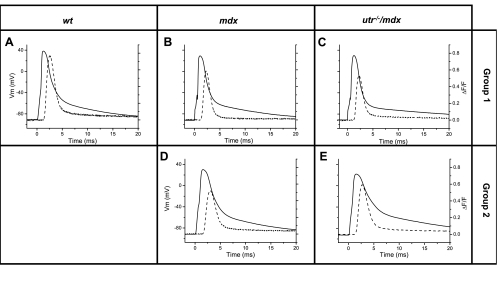
Fig. 4.
APs and OGB-5N transients recorded from WT and pregrouped mdx and utr−/−/mdx fibers. A–E: superimposed electric (solid lines) and OGB-5N (dashed lines) signals responses in response to single stimulation recorded from a WT (A), a mdx-1 (B), a mdx-2 (D), an utr−/−/mdx-1 (C), and an utr−/−/mdx-2 (E) fiber. AP peak, AP FDHM, ΔF/F peak, ΔF/F FDHM values for each of these experiments were 128 mV, 2.46 ms, 0.75, 1.83 ms (WT); 119 mV, 2.07 ms, 0.59, 1.44 ms (mdx-1); 120 mV, 3.33 ms, 0.52, 2.1 ms (mdx-2); 120 mV, 1.95 ms, 0.52, 1.5 ms (utr−/−/mdx-1); 112 mV, 4.26 ms, 0.60, 2.07 ms (utr−/−/mdx-2).

