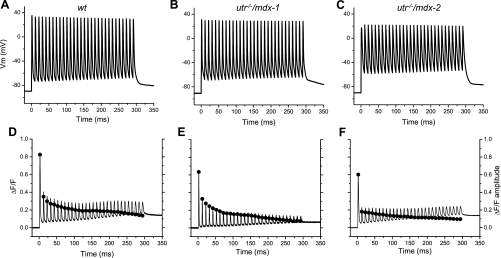
Fig. 5.
APs and OGB-5N transients elicited by a train of high-frequency pulses. APs (solid traces, A–C) and corresponding OGB-5N (solid traces in D–F) elicited by trains of 30 pulses applied at 100 Hz. Data from WT, utr−/−/mdx-1, and utr−/−/mdx-2 fibers are shown in A and D, B and E, and C and F, respectively. Filled circles in D–F represent the amplitude of OGB-5N transients.

