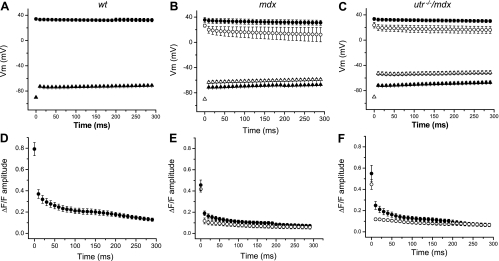
Fig. 6.
Peak and interpulse values of APs and OGB-5N transients during high-frequency stimulation. A–C: pooled data of the mean peak values (circles) and interpulse potentials (triangles) of APs recorded in response to 100-Hz stimulation from WT (n = 8); mdx-1 (closed symbols, n = 8), and mdx-2 (open symbols, n = 3); and utr−/−/mdx-1 (closed symbols, n = 3) and utr−/−/mdx-2 (open symbols, n = 3). D–F corresponding mean amplitude values of pooled data (circles) of OGB-5N transient recorded in correspondence to data in A–C respectively. Symbols represent means ± SE.

