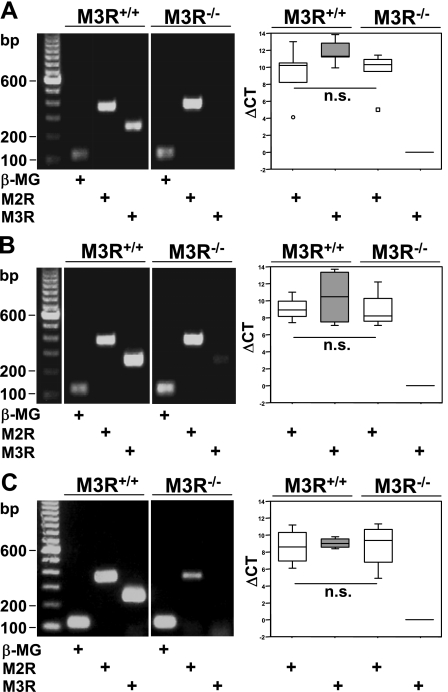
Fig. 7.
A–C: real-time RT-PCR. cDNA were derived from lung homogenate (A; n = 5), tracheal muscle (B; n = 4), and urinary bladder (C; n = 4) from M3R+/+ and M3R−/− mice each. Changes in cycle threshold (ΔCT) values were calculated for M2R and M3R using β-microglobulin (β-MG) as reference gene and PCR products of M2R, M3R, and β-MG separated on agarose gels. Images in A–C originate from the same gel, each, after excluding irrelevant samples. Box plots: percentiles 0, 25, median, 75, 100; extreme values (○), outlier (☐); n = number of animals; n.s., not significant.

