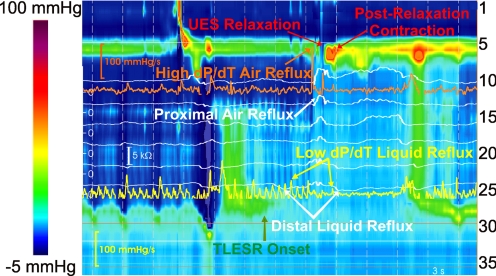
Fig. 3.
Color plot of esophageal pressures representing dP/dt in proximal and distal esophagus during a mixed (liquid and air) reflux episode in upright TLESR. Impedance recordings are superimposed as white tracings, and dP/dt tracings in proximal and distal esophagus are presented as orange and yellow tracings, respectively.

