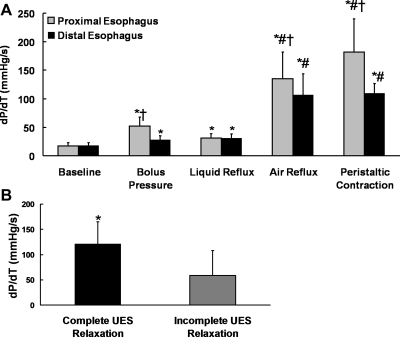
Fig. 6.
A: comparison of rate of pressure change dP/dt in different positions. *P = 0.01 compared with baseline, #P < 0.001 compared with baseline, liquid reflux, and bolus pressure, †P < 0.01 distal compared with proximal. B: comparison of reflux related to esophageal dP/dt during complete and incomplete UES relaxation, n = 47 for complete UES relaxation, n = 15 for incomplete relaxation. *P < 0.001.

