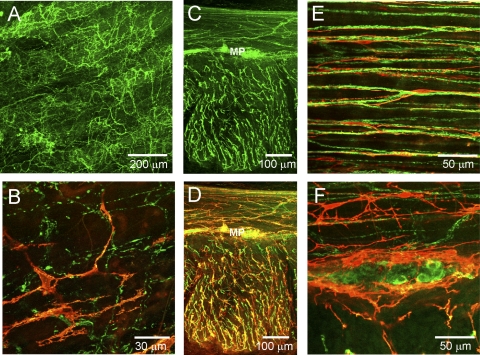
Fig. 5.
Dual labeling of ICC and nitrergic nerves with anti-KIT (red) and anti-neuronal nitric oxide synthase (nNOS; green) antibodies in the IAS (A and B) and rectum (C–F). A: distribution of nNOS-positive cells through the thickness of the IAS in a thick transverse section. B: dual labeling of a thick transverse section of IAS showing marked differences in the overall distribution of nNOS and KIT-positive cells. C and D: 2 images of the same thick cross section of rectal muscle. C: distribution of nNOS positive cells. D: dual image of nNOS and KIT-positive cells at low power (×20) reveals similar distribution of NOS fibers and ICC (yellow). E: high-magnification image of transverse section of circular muscle showing close association of KIT and nNOS-positive cells. F: high-magnification image of a myenteric ganglia containing nNOS-positive cell bodies surrounded by KIT-positive cells. Optical section thickness: A, 18 μm; B, 2 μm; C, 23 μm; D, 23 μm; E, 3.75 μm; F, 11 μm.

