Fig. 6.
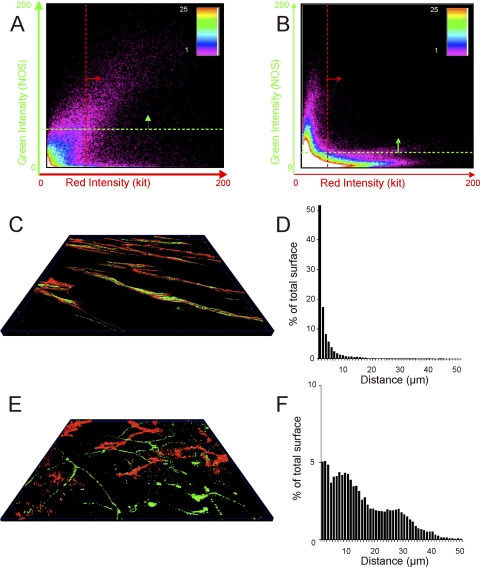
Colocalization and apposition of NOS-labeled and KIT-labeled structures in the IAS and rectum. A and B: plots showing the number of pixels (see spectrum scale bar) averaged throughout the stack at different intensities of red (x-axis) and green (y-axis) in rectum (A) and IAS (B). The quadrant above the green line and to the right of the red line indicates pixels considered to contain both KIT (red) and NOS (green) signals (i.e., sites of colocalization). Greater colocalization of signals is seen in rectum than in IAS. C and E: 3D surface reconstructions (see Ref. 30) of KIT and NOS labeling in IAS (C) and rectal (E) images. D and F: the distance between surface reconstructions was used to obtain the values plotted in histograms D (IAS) and F (rectum) that show the percent of total KIT and NOS surface triangles (y-axis) with minimum distances ranging from 1 to 50 μm (x-axis) in IAS (D) and rectum (F).

