Fig. 5.
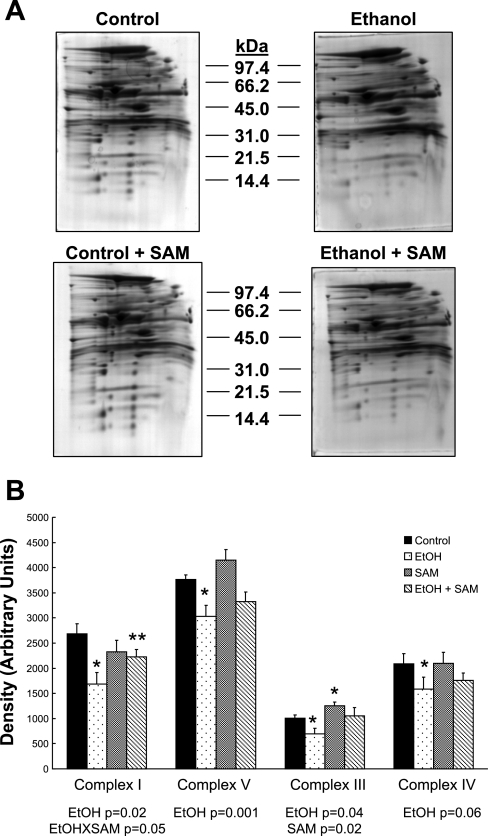
Representative 2D blue native gel electrophoresis (BN-PAGE) gels of liver mitochondrial proteins. A: mitochondrial protein from livers of control, ethanol, control + SAM-, and ethanol + SAM-treated groups were subjected to BN-PAGE as described in materials and methods. B: comparison of the relative quantities of complexes I, V, III, and IV in liver mitochondria from the 4 treatment groups. Data represent means ± SE, n = 4 animals per each group; *P < 0.05 compared with control; **P < 0.05 compared with EtOH. Results from 2-factor ANOVA for each complex are reported in B.

