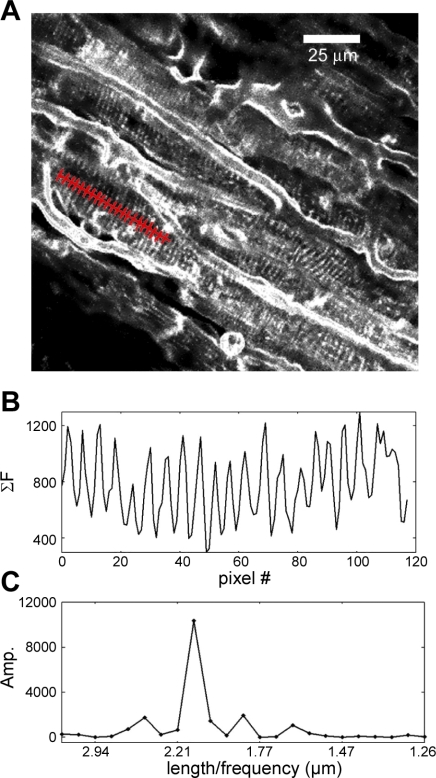
Fig. 1.
Sarcomere length (SL) measurement software operation. A: image sets from 1-(3-sulfonatopropyl)-4-{β-[2-(di-N-butylamino)-6-naphthyl]vinyl}pyridinium betaine (di-4-ANEPPS)-labeled tissue are obtained using a two-photon microscope. A user-defined path, restricted by cell boundaries and entered nearly perpendicular to the striation pattern, is shown in red. B: intensity profile of the user-drawn path. Intensity values are summed for pixels perpendicular to the user path (3 pixels for each point) and plotted as shown (see methods). C: discrete Fourier transform (DFT) of the intensity profile in B.

