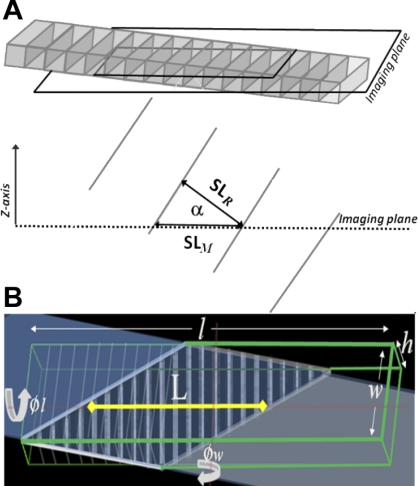
Fig. 2.
A: schematic illustration of how cell angle relative to the two-photon fluorescence image plane (α) affects apparent (measured) SL (SLM). The cell is rotated about the rotational axis through the cell center aligned with cell width. The cell's real SL (SLR) is a function of SLM and α. B: a diagrammatic representation of a cell (outlined by the green lines) with dimensions length (l) width (w), and height (h) and rotated by 15 and 25 degrees around the rotational axes through the cell center aligned with the cell width (ϕw) and length (ϕl), respectively, shown relative to the imaging plane (shaded section). The appearance of the cell in the image plane is given by the trapezoid (bold white lines).

