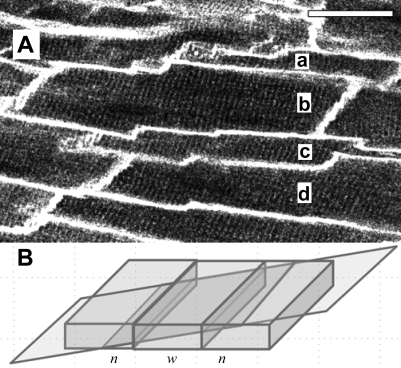
Fig. 4.
A: cells a-d display an alternating narrow-wide-narrow pattern of apparent cell morphology (scale bar 30 μm). B: the pattern observed in A can be explained by the angle of the two-photon fluorescence image plane relative to tissue orientation in a modeled densely packed layer of cells, which yields a similar narrow-wide-narrow (n, w, n) pattern.

