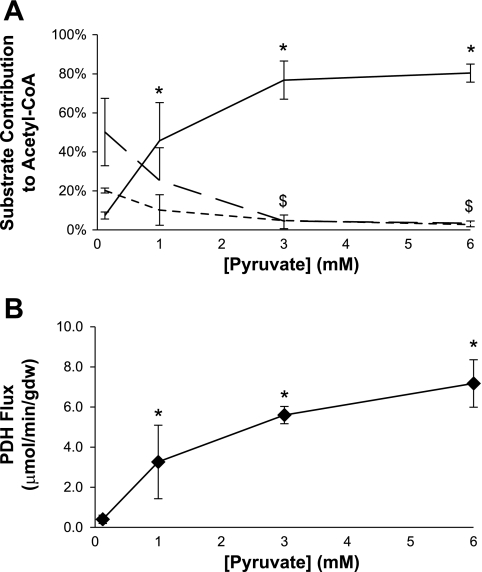
Fig. 3.
Influence of [pyruvate] on sources of acetyl-CoA and flux through pyruvate dehydrogenase (PDH) using a fed buffer. A: relative rates of oxidation of ketones (dotted line), long-chain fatty acids (broken line), or pyruvate (solid line) are shown. At 3 mM pyruvate, oxidation of competing substrates is largely suppressed. B: flux through PDH. Flux through PDH is maximal at 3–6 mM pyruvate. Data are means ± SD. Analysis of variance revealed statistically significant responses to increased [pyruvate] for pyruvate (P < 0.0001), fatty acid (P = 0.004), ketone body oxidation (P = 0.006), and PDH flux (P = 0.0004). *P < 0.05 [pyruvate] vs. [pyruvate] = 0.12 mM. $P < 0.05 for fatty acids and ketone bodies vs. respective 0.12 mM data point.

