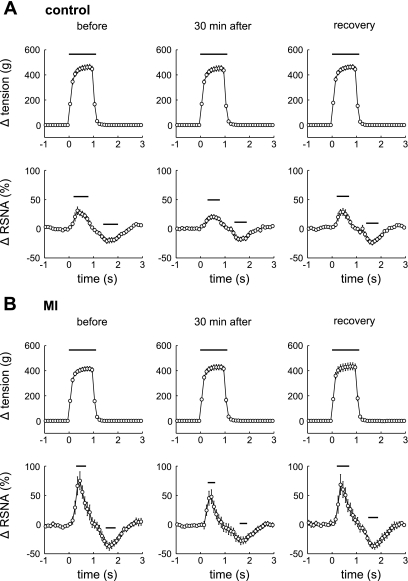
Fig. 2.
Changes from baseline in muscle tension and RSNA (averaged over every 100 ms) during a cycle averaged over 12 interventions of muscle contraction in 16 controls with 49 ± 2% of FS (A) and 16 MI rats with 20 ± 2% of FS (B) before and 30 min after injection of HOE-140 (2 μg/kg) as well as recovery (60 min after injection). Values are means ± SE. Time = 0 indicates the onset of tension development. The changes in these values from baseline were evaluated with each basal value averaged for 30 s just before the first contraction. Horizontal bars indicate significant differences in the responses from baseline, detected by Dunnett post hoc test following 1-way repeated ANOVA.

