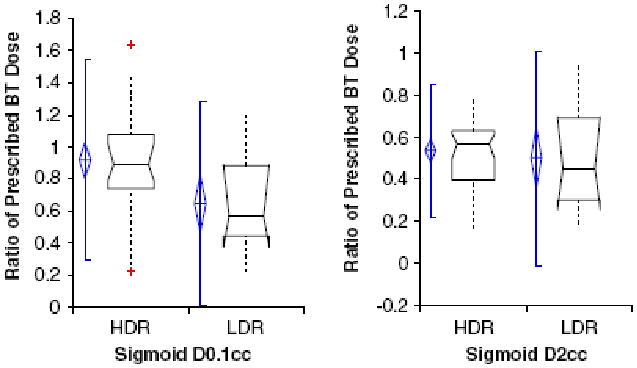
Figure 1.

The ratio of sigmoid DVH dose to prescribed point A dose as DO.1cc or D2cc for HDR and LDR brachytherapy. The diamond shape reflects the 95% Confidence Interval of the mean. The bar represents two standard deviations above and below the mean. The box plot width related to sample size, and the horizontal line through the box represents the median value. The dashed lines above and below the box plot are data points.
