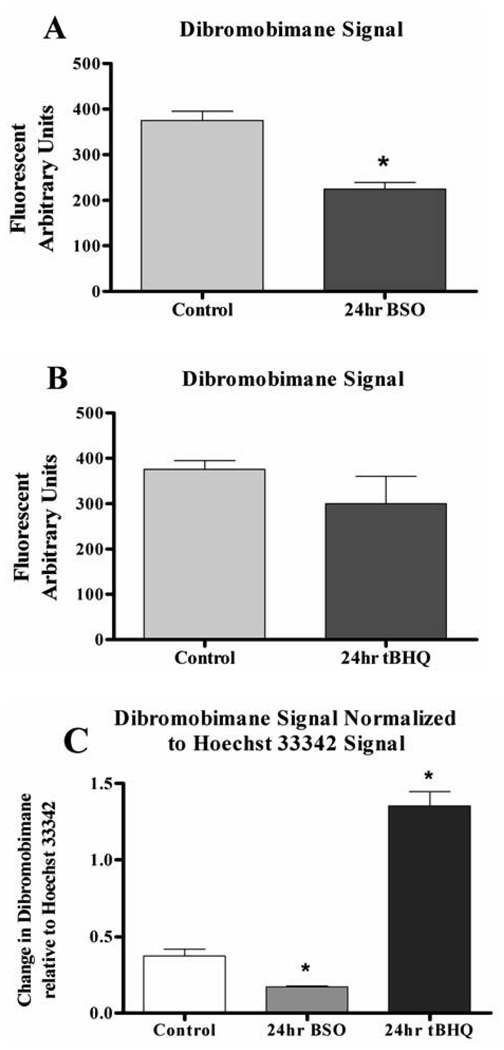
Figure 2.
Changes in GSH status of HEK293T cells exposed to GSH modulating agents. A) HEK293T cells exposed to 100µM BSO or B) 25µM tBHQ for 24 hours. C) Normalized values of dBBr from A and B, indicative of the GSH levels in the cells. All values are reported as mean ± SEM. * Indicates a significant fluorescent difference from control at p < .05.

