
Fig. 3.
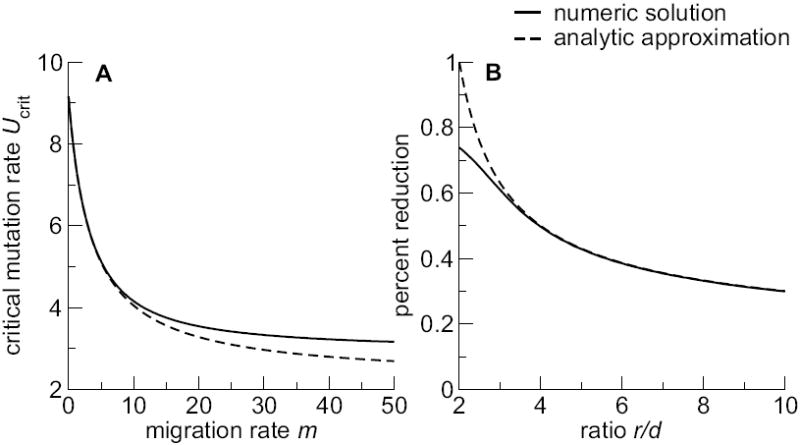
Effect of migration on the critical mutation rate. (A) Critical mutation rate vs. migration rate m, for fixed ratio R0 = 5/2. The dashed line shows Eq. (20). (B) Percent reduction in the critical mutation rate between no migration and maximum migration, as a function of the ratio R0. The dashed line shows Eq. (21). For both (A) and (B), parameters are α1 = 0.1, α2 = 1.0, and d = 5.