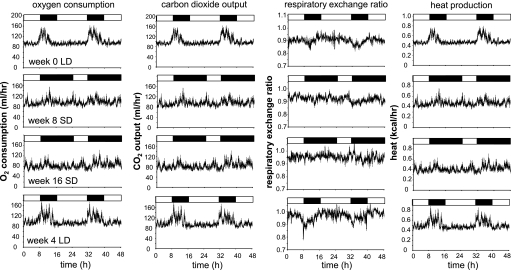
Fig. 3.
Oxygen consumption (left), carbon dioxide production, respiratory exchange ratio, and heat production (right) in adult male hamsters at week 0 (top), week 8 in SD (second row), week 16 in SD (third row) and 4 wk after return to LD (bottom). Lighting regimes are represented by bars above each graph (solid bars denote dark phase, and open bars denotes light phase). Values are expressed for each 9-min bin as group means ± SE; n = 8.

