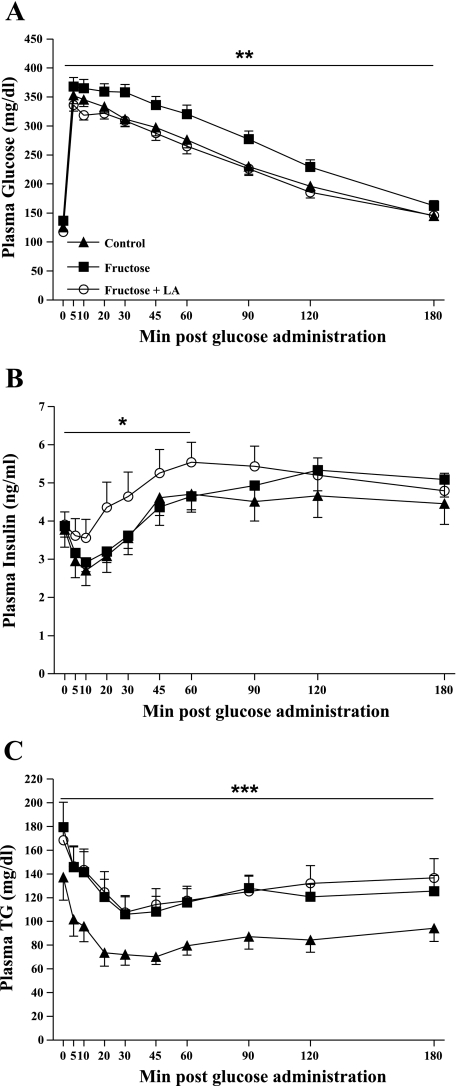
Fig. 3.
Plasma glucose (A), insulin (B), and triglycerides (TG) (C) excursions following intravenous glucose administration (500 mg/kg body wt, 50% dextrose solution) in control (n = 15), fructose (n = 20), and fructose + LA (n = 18) prediabetic rats at 3.5 mo of age. Values are expressed as means ± SE. *P < 0.05 compared with fructose, **P < 0.05 compared with control and fructose + LA, ***P <0.05 compared with control by one-factor ANOVA. For TG values, control: n = 13, fructose: n = 19, fructose + LA: n = 17.

