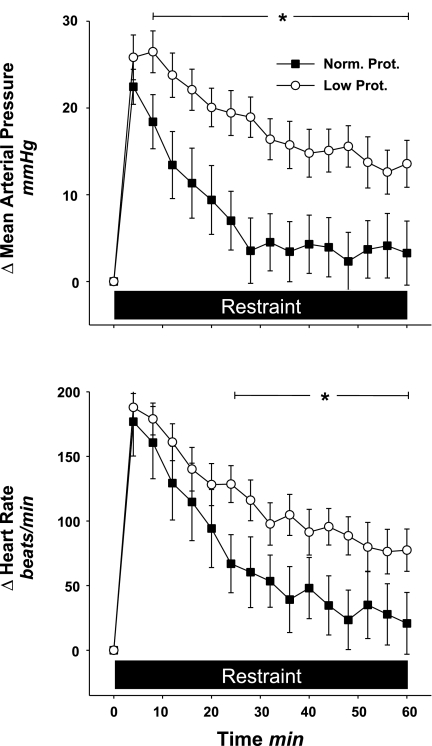
Fig. 3.
Change in mean arterial pressure and heart rate from baseline during 1 h of restraint stress in normal-protein (n = 6) and low-protein (n = 11) offspring. Note that the change in mean arterial pressure and heart rate in the low-protein offspring was significantly higher compared with the normal-protein offspring. Black bar, time period of restraint stress. *P < 0.05 vs. Norm. Prot.

