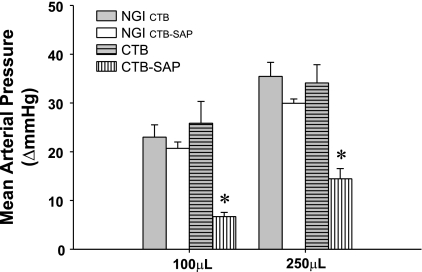
Fig. 2.
Change in mean arterial pressure in response to 100 μl and 250 μl of hNa+Cl− injected into the gluteus maximus muscle in the NGI group, CTB celiac-injected group, and CTB-SAP celiac-injected group. The control data for the CTB and CTB-SAP rats are presented separately. Specifically, the 3 animals that received CTB were matched with their response before injection (NGI CTB). The 5 animals that received CTB-SAP were matched with their response before injection (NGI CTB-SAP). There was no difference in the arterial pressure response to 100 μl or 250 μl of hNa+Cl− between the NGI and CTB groups. However, the arterial pressure response to both 100 μl and 250 μl of hNa+Cl− were significantly lower in the CTB-SAP group documenting an attenuated autonomic dysreflexia. *P < 0.05 CTB-SAP vs. NGI and CTB.

