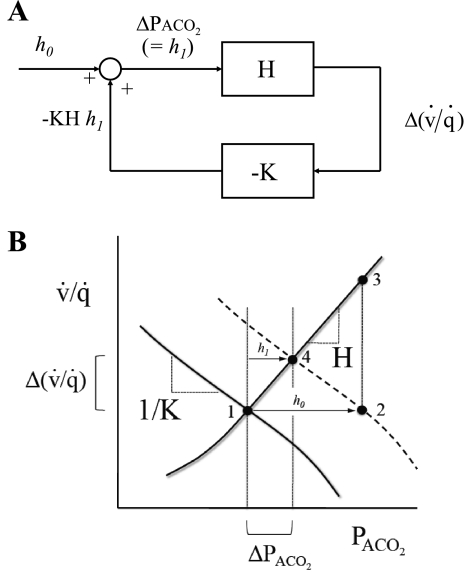
Fig. 1.
Depiction of the control system regulating the local alveolar Pco2 (PaCO2) within the lung [for alveolar Po2 (PaO2), the analysis is analogous]. A and B illustrate the derivation of Eq. 15. In A, the lines represent variables [e.g., Δ(v̇/q̇), where v̇/q̇ is ventilation-to-perfusion ratio] within the control system, the rectangular boxes depict the transforms for the change in 1 variable brought about by the change in another, and the circle represents the addition of the changes in 2 incoming variables to generate an outgoing variable. In the absence of any disturbance (i.e., h0 = 0), ΔPaCO2 and Δ(v̇/q̇) are both 0, and the control system is at point 1 (see B). A step-function finite disturbance in PaCO2 (i.e., h0 ≠ 0) is illustrated at point 2 in B. If no feedback is present (an open loop), then this disturbance would result in a disturbance of v̇/q̇ illustrated at point 3 in B. However, in the presence of feedback (a closed loop), the control system is at point 4 in B. Here, the final value for ΔPaCO2 is h1 [and the final value for Δ(v̇/q̇) is h1H]. Summation at the junction depicted by the circle in A yields the result that ΔPaCO2 (= h1) = h0 − KHh1, which is Eq. 15.

